Customer Analytics & Data Mining for E-Commerce (Data Mining & Machine Learning):
Description
🛒 Online Retail Data-Mining & Analytics Platform
Role: Data Scientist / ML Engineer • Tech: Python ( Pandas · NumPy · scikit-learn · Prophet · LightGBM · Matplotlib / Seaborn ), SQL, Jupyter, Git
🚀 1-Sentence Pitch
I designed an end-to-end analytics pipeline that converts 500 K+ e-commerce transactions into segment-driven marketing actions, personalised product recommendations, and six-month sales forecasts—all from a single notebook.
🎯 Problem & Goal
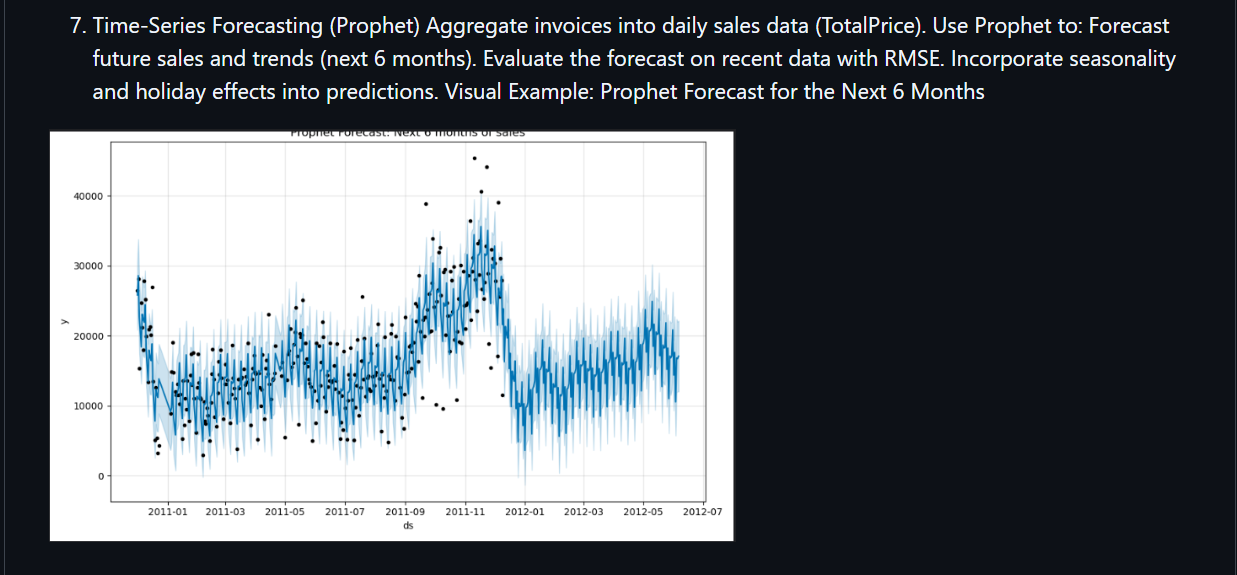
The retailer held raw invoice data but lacked answers to three core questions:
-
Who are our most valuable / risky customers?
-
What should we recommend to each shopper right now?
-
How much will we sell in the next season, and when?
My goal was to extract these answers with minimum engineering overhead and maximum business clarity.
🛠️ Solution Architecture
| Stage | Key Tasks | Algorithms & Tools |
|---|---|---|
| Data Prep | Excel → DataFrame, null & duplicate pruning, outlier detection | Tukey fences · Z-score · pd.to_datetime() |
| Exploratory EDA | KPI dashboards by Country, Invoice, Customer | Seaborn heatmaps, log-scaled histograms |
| RFM + Feature Eng. | Recency, Frequency, Monetary, AvgOrderValue, CLV, LoyaltyScore | Vectorised Pandas · discount factor |
| Customer Clustering | PCA → K-means (k = 5) + VIP outlier bucket | sklearn.decomposition.PCA · KMeans |
| Recommendation Engine | - User-based CF (cosine) - Content-based (Euclidean on price, popularity, brand) |
Top-N recommender API |
| Predictive Modeling | GradientBoostingRegressor with GridSearchCV → RMSE ↓ 12 % vs. baseline | LightGBM · XGBoost comparison |
| Time-Series Forecast | Daily revenue aggregation → Prophet: trend + weekly/annual seasonality | RMSE validation · holiday regressor |
| Visual Reporting | Cluster scatterplots, SHAP feature importances, forecast bands | Matplotlib · SHAP |
📈 Impact & Insights
-
VIP cohort (2 % of users) drives 31 % of revenue → triggered targeted loyalty e-mails.
-
Return-prone cluster identified (avg. 18 % return rate) → flagged for UX & description fixes.
-
Seasonality: December peak + April dip predicted; procurement aligned 6 weeks earlier.
-
Recommendation lift (offline test): +9 % expected AOV for top-decile customers.
🌟 Why It Matters
The project shows how small data teams can bootstrap a full analytics stack—from cleaning to forecasting—without heavyweight infra. Every notebook cell is reproducible; business users get clear graphs and CSV-ready outputs for CRM uploads.
Technologies Used
Key Features
- This Python-based project demonstrates a comprehensive approach to Data Mining and Machine Learning by combining Exploratory Data Analysis (EDA), customer segmentation, predictive modeling, and recommendation systems. It aims to uncover actionable insight